Navigating the Platform
The left sidebar is your primary navigation in TraptureIQ. This guide explains every sidebar item, what it does, who can see it, and how to find what you need.
The Sidebar Layout
The sidebar is divided into three areas:
- Top area — Tenant name/logo and Tenant Switcher
- Main navigation — All platform modules
- Bottom area — Settings, Support, Theme toggle, and collapse button
The sidebar can be collapsed (icon-only mode) by clicking the collapse button at the bottom. This gives you more screen space for content.
Main Sidebar Items — Complete Reference
Here's every item you'll find in the sidebar, what it does, and who can access it:
| Sidebar Item | What It Does | Who Can See It | When to Use It |
|---|---|---|---|
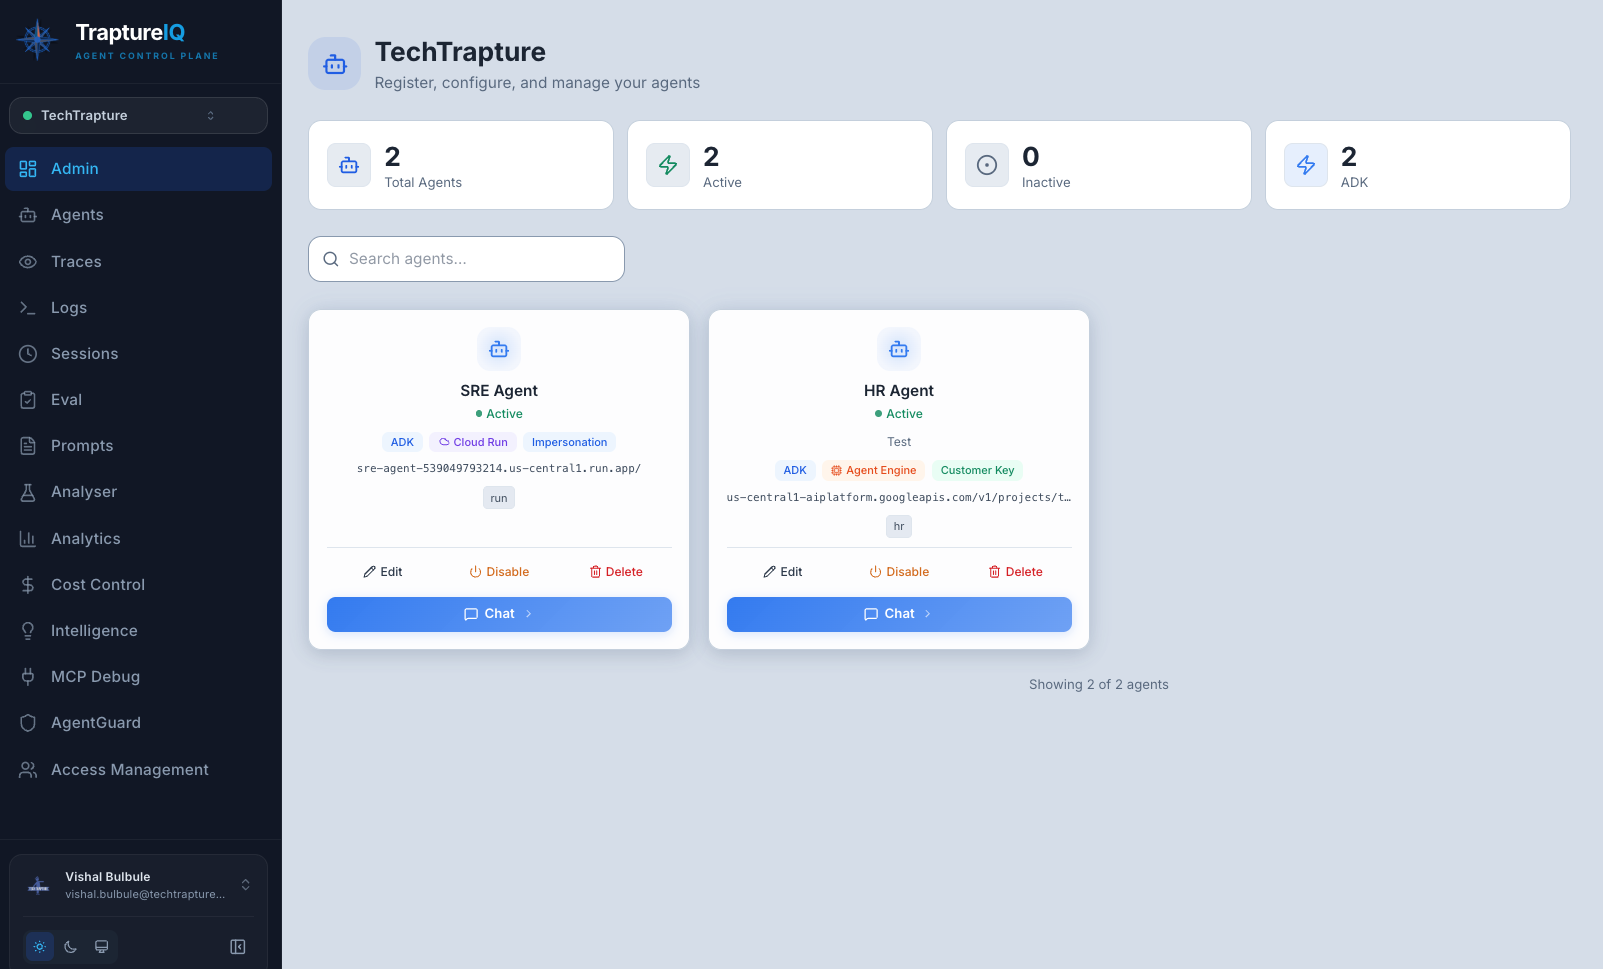
| Admin | Dashboard showing agent statistics (total, active, inactive), framework breakdown, and quick actions to register/manage agents | Tenant Admins only | When you need an overview of all agents in your workspace or want to register a new agent |
| Agents | Browse all registered agents as cards or a list. Each card shows the agent's status, framework, deployment type, and a "Chat" button | Users with Agents access enabled | When you want to find an agent and start chatting with it |
| Traces | Visualize the step-by-step internal reasoning of your agents with waterfall timelines and span details | Users with Traces access enabled | When you want to debug why an agent gave a certain response or where it got stuck |
| Logs | Centralized log viewer showing every request and response with severity levels, timestamps, and metadata | Users with Logs access enabled | When you need to audit conversations, track errors, or export data for compliance |
| Sessions | Historical view of all chat sessions with statistics, charts, and filtering by agent/user/time | Users with Session access enabled | When you want to review past conversations, see usage trends, or audit specific interactions |
| Eval | Evaluation suite with three types: Custom Eval (quality testing), Security Eval (vulnerability testing), Load Test (performance testing) | Users with Eval access enabled | When you want to measure agent quality, test for security vulnerabilities, or stress-test performance |
| Prompts | Version-controlled prompt library. Create, edit, version, and analyze system prompts with AI-powered scoring | Users with Prompts access enabled | When you want to manage system prompts, test prompt quality, or share prompts across your team |
| Analyser | Token counting and cost estimation tool. Paste any text and see token counts across multiple LLM models | All users (always visible) | When you want to check how many tokens a text consumes or estimate costs before sending to an agent |
| Analytics | Usage dashboards showing request volume, session counts, latency, error rates, tool usage, and agent performance | Tenant Admins only | When you want to understand how the platform is being used and identify performance bottlenecks |
| Cost Control | Token cost tracking with breakdowns by agent, user, and session. Shows input/output/thinking token costs | Tenant Admins only | When you want to monitor and optimize your LLM spending |
| Intelligence | Agent reasoning insights — LLM call patterns, thinking token distribution, tool invocation analysis | All users (always visible) | When you want to understand how your agents think, which tools they use most, and where they spend reasoning effort |
| MCP Debug | Test and debug Model Context Protocol integrations with 18 Google Cloud MCP servers | Users with MCP Debug access enabled | When you're building agents that use MCP tools and want to validate connections before deploying |
| AgentGuard | Security firewalls — configure blocked phrases, country restrictions, PII filtering, and monitor safety events | Tenant Admins only (requires AgentGuard enabled in Settings) | When you want to set up security rules or review blocked/flagged messages |
| Access Management | User management hub — invite users, assign roles, configure section access, manage agent access, view permission matrix, and access settings | Tenant Admins only | When you need to manage your team's access to the platform |
Bottom Sidebar Items
Below the main navigation, you'll find these controls:
| Item | What It Does |
|---|---|
| User Profile Menu | Shows your name and email. Click to access your profile or sign out |
| Settings | Opens the Settings page — manage Tenant details, API keys, billing, subscription, and AgentGuard toggle |
| Support | Access help resources and contact the TraptureIQ team |
| Pricing / Upgrade | View available subscription plans (visible when on trial or expired subscription) |
| Theme Toggle | Switch between light and dark mode (sun/moon icon) |
| Collapse/Expand | Toggle the sidebar between full-width and icon-only mode |
How Visibility Works
Understanding why you can or can't see certain sidebar items:
For Tenant Admins
- You see every sidebar item listed above.
- You have unrestricted access to all platform modules.
For Tenant Users
- You only see items your admin has enabled for you via Section-Level Access.
- Items marked as admin-only (Admin, Analytics, Cost Control, AgentGuard, Access Management) are completely hidden — you cannot see or navigate to them.
- Analyser and Intelligence are always visible regardless of your configuration.
- If you navigate directly to a URL for a section you don't have access to, you will be redirected to the Agents page.
AgentGuard Visibility
AgentGuard has an additional requirement: it must be enabled in your Tenant's Settings before it appears in the sidebar. Even Tenant Admins won't see it until it's activated.
Finding What You Need — Quick Reference
| I want to... | Go to... |
|---|---|
| Chat with an AI agent | Agents → find your agent → click Chat with Agent |
| Debug why an agent gave a wrong answer | Traces → filter by agent and time range → inspect the waterfall |
| See all conversations that happened today | Sessions → set time filter to "Last 24h" |
| Check if an agent is leaking sensitive data | AgentGuard → Content Safety Dashboard |
| Test my agent against jailbreak attacks | Eval → Security Eval → select Jailbreak template |
| See how much my agents are costing | Cost Control → filter by agent and time range |
| Count tokens in my prompt before using it | Analyser → paste your text |
| Invite a colleague to my workspace | Access Management → click Invite User |
| Test a BigQuery MCP connection | MCP Debug → Add Connection → select BigQuery |