Logs — Your Complete Audit Trail
Access: Users with Logs permission enabled by their Admin
The Logs module provides a centralized, searchable record of every interaction across your entire workspace. While Traces show you the internal logic of each request, Logs give you the full audit trail — who sent what, when, and what the agent returned.
What are Logs?
Every time a user sends a message to an agent, TraptureIQ records the complete interaction as a log entry. This includes:
- The user's original prompt
- The agent's response
- Token counts (input, output, thinking)
- Latency (how long the agent took)
- Model version used
- Any safety flags or errors
Why it matters:
- Compliance — Maintain a permanent, tamper-proof record of every AI conversation for regulatory requirements
- Cost Analysis — Identify which users or agents consume the most tokens
- Error Tracking — Filter by error types to find agents that are failing or hitting token limits
- Debugging — Inspect the raw API payloads to understand exactly what was sent and received
How to Use the Logs Page
Step 1: Open the Logs Page
- Click Logs in the sidebar.
- The page loads with two areas: charts at the top and a log table below.
Step 2: Understand the Layout
Top Area — Volume Charts:
- A line or bar chart showing request volume over time
- Helps you quickly spot spikes in activity or error rates
- Adjusts based on your selected time range
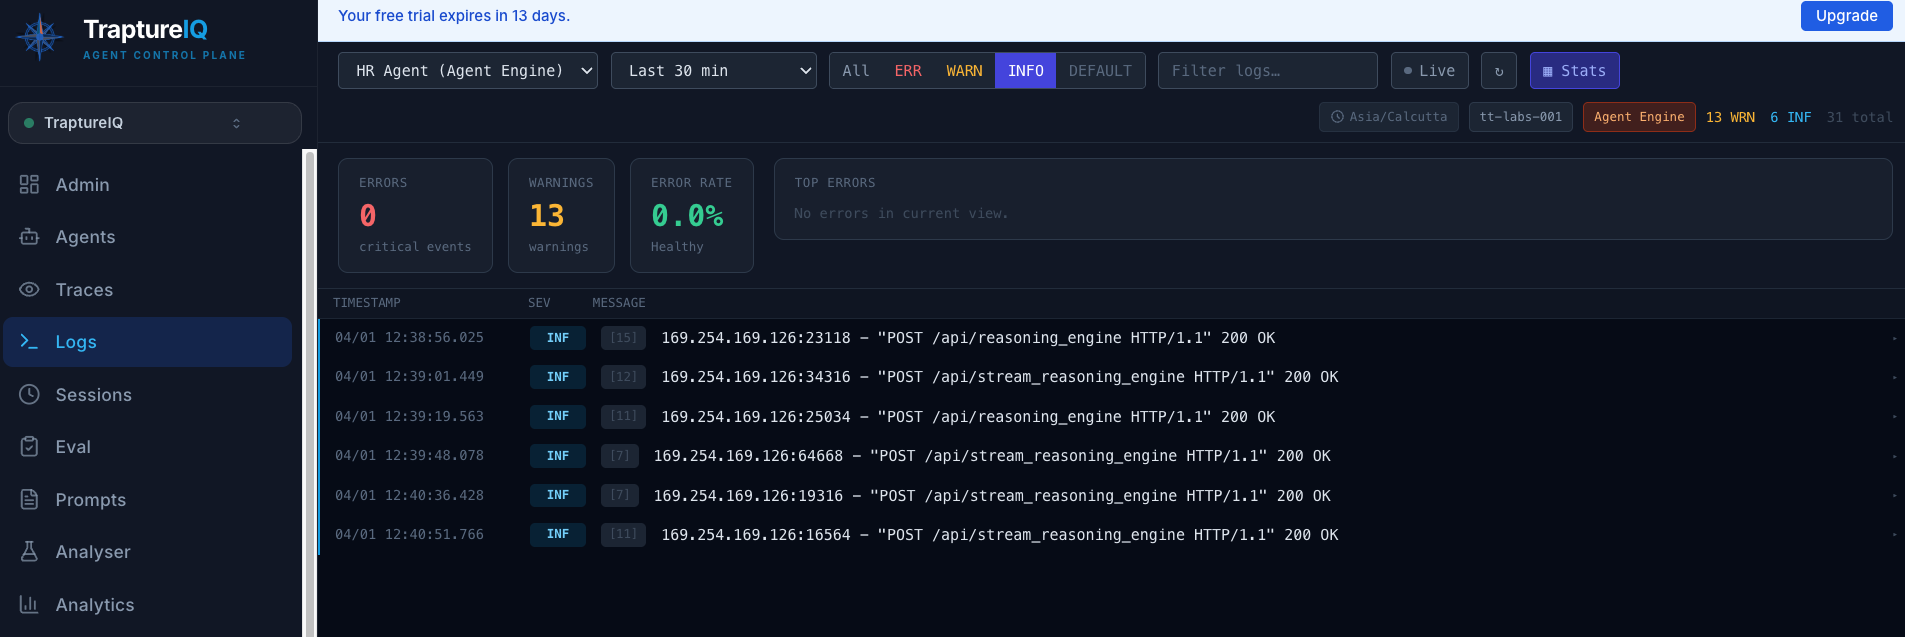
Main Area — Log Table: A detailed, tabular view of every logged interaction. Key columns include:
| Column | What It Shows |
|---|---|
| Timestamp | When the interaction occurred |
| Agent | Which agent handled the request |
| User | Who sent the request |
| Severity | Log level — INFO, WARNING, ERROR, DEBUG, DEFAULT |
| Latency | Response time in seconds |
| Tokens (Input) | Number of tokens in the user's prompt |
| Tokens (Output) | Number of tokens in the agent's response |
| Model | Which LLM model was used |
| Finish Reason | How the response ended (STOP = normal, MAX_TOKENS = hit limit) |
Tip: Columns are resizable — drag the borders to make columns wider or narrower.

Step 3: Filter Logs
Use the filter controls at the top to narrow down results:
| Filter | What It Does | Example Use Case |
|---|---|---|
| Severity Level | Show only logs of a specific severity (ERROR, WARNING, INFO, DEBUG, DEFAULT) | "Show me only errors from the last 24 hours" |
| Time Range | Limit to a specific time period | "Show me yesterday's logs" |
| Agent | Filter by a specific agent | "Show me only Support Bot logs" |
| User | Filter by a specific user | "Show me John's interactions" |
Severity levels explained:
| Level | Color | What It Means |
|---|---|---|
| ERROR | Red | Something went wrong — the agent failed to respond or an exception occurred |
| WARNING | Yellow | Something unexpected happened but the agent still responded (e.g., a deprecated API, rate limit warning) |
| INFO | Blue | Normal operation — a standard request-response cycle |
| DEBUG | Grey | Detailed diagnostic information (usually only visible when debugging is enabled) |
| DEFAULT | White | Standard log entry without a specific severity |
Tip: Click any log row to expand the full detail view — raw metadata, grounding citations, safety flags, and the complete agent response.
Common Use Cases
| Scenario | What to Do |
|---|---|
| "I need to find all errors from the past week" | Set time range to "Last 7 days", filter severity to "ERROR" |
| "I want to see which agent uses the most tokens" | Go to Analytics → Cost Control for per-agent token and cost breakdown |
| "I need a compliance report of all conversations" | Go to Sessions, apply your desired time range and agent filters, and export the records |
| "I want to see all security breaches or blocked messages" | Go to AgentGuard → Content Safety, filter by time range, and click Export CSV |
| "I want to check why a specific response was blocked" | Find the log entry, click to expand, and check the Safety Flags section |
| "An agent keeps hitting token limits" | Filter by the agent and look for entries where the Finish Reason column shows "MAX_TOKENS" |
Tips for Beginners
- Start with INFO level — Most log entries are INFO (normal operations). Switch to ERROR only when investigating issues.
- Use the volume charts — The charts at the top quickly show you if something unusual is happening (sudden spike in errors, for example).
- Use filters for compliance reviews — If your organization requires compliance records, use time range + agent filters to narrow down and review the relevant interactions.
- The Detail Inspector is your friend — When you need to understand exactly what happened in an interaction, the raw JSON payload tells the complete story.