Traces — AI Agent Observability for Google ADK
Access: Users with Traces permission enabled by their Admin
The Traces module is the heart of AI agent observability in TraptureIQ. It reveals the hidden internal reasoning that happens between when you send a message and when your Google ADK agent replies — surfacing every sub-agent delegation, tool call, and LLM invocation as a single, timed tree of spans.
Traces consume the OpenTelemetry GenAI signals that Google ADK emits by default, so there's nothing to instrument — register your ADK agent and traces start flowing.
What is a Trace?
When you send a message to an AI agent, it doesn't just generate a response in one step. Behind the scenes, the agent may perform multiple hidden actions:
- Querying a database to look up information
- Searching the web for relevant results
- Calling another "worker" agent to handle a sub-task
- Reflecting on its own logic before responding
- Using tools (like a calculator or file reader)
- Making multiple LLM calls to refine its answer
A Trace captures and visualizes every single one of these internal steps (called "spans"). It's like an X-ray showing you exactly what happened inside the agent's brain.
Why it matters: Without traces, when an agent gives a wrong answer or takes too long, you're left guessing what went wrong. With traces, you can pinpoint the exact step that caused the problem.
How to Use the Traces Dashboard
Step 1: Open the Dashboard
- Click Traces in the sidebar.
- The dashboard loads showing a table of recent traces.
Step 2: Understand the Layout
Top Area — Time Range Controls: Select how far back to look for traces. Options include:
- Real-time: 5 min, 15 min, 30 min, 60 min
- Historical: 1 day, 7 days, 30 days, All Time
- Custom: Pick a specific date range
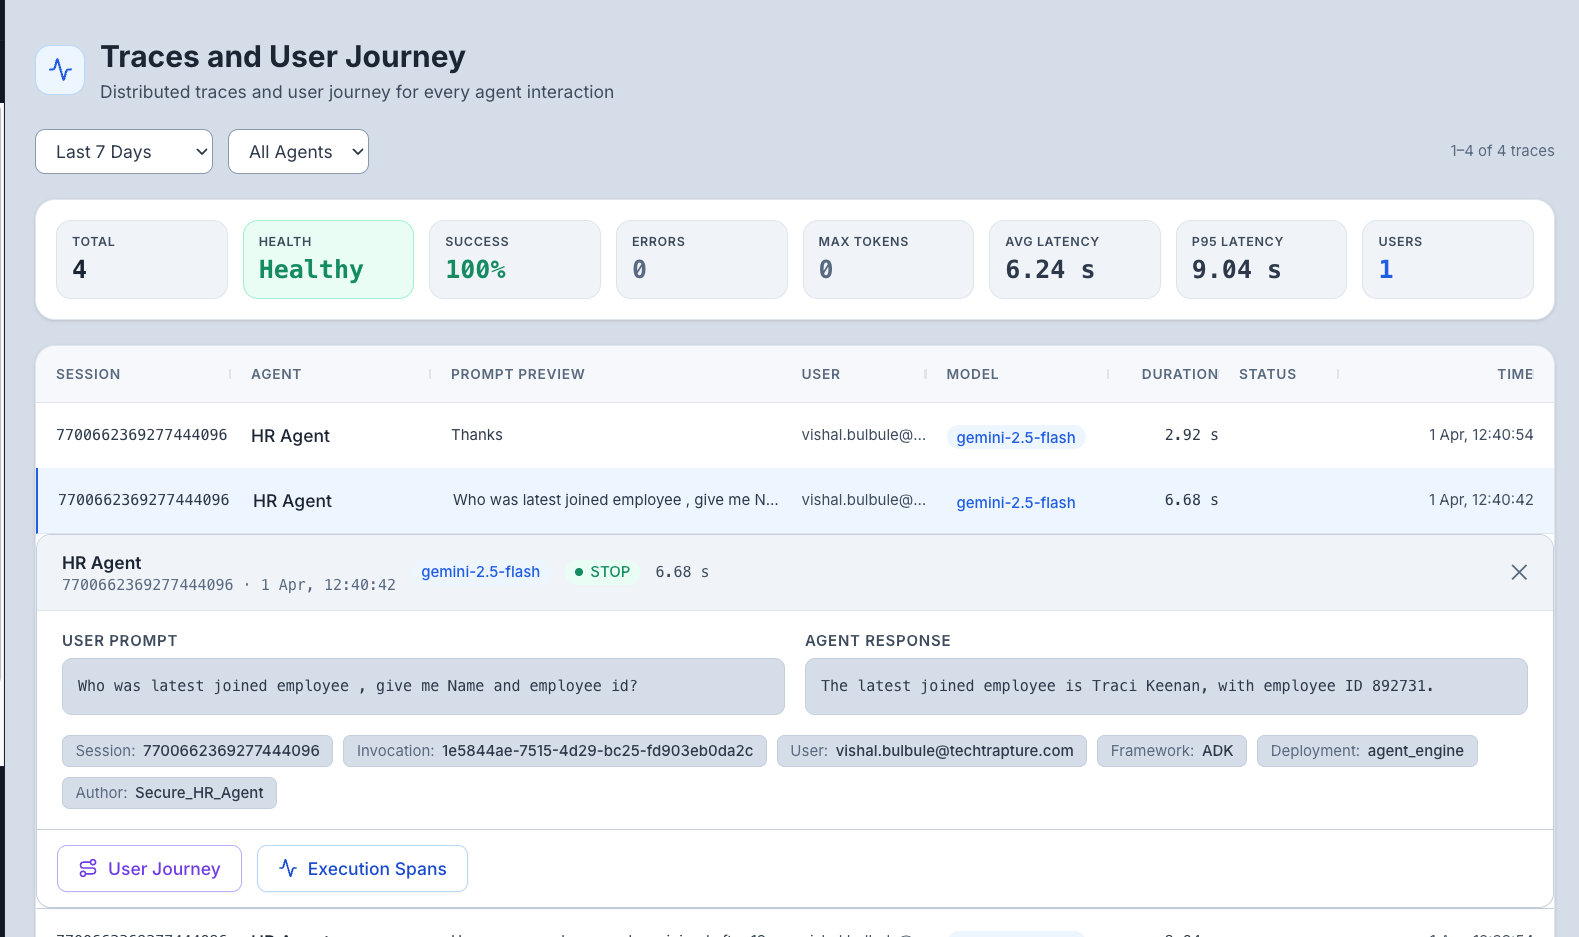
Main Area — Trace Table: Each row represents one agent invocation (one user message → agent response cycle). Columns include:
| Column | What It Shows |
|---|---|
| Timestamp | When the invocation happened |
| Agent | Which agent processed the request |
| User | Who sent the message |
| Duration | Total time from user prompt to final response |
| Status | How the invocation ended (STOP = normal, MAX_TOKENS = hit limit, ERROR = failed) |
| Token Count | Total tokens used across all internal LLM calls |
Tip: Columns are resizable — drag the column borders to adjust widths.
Step 3: Inspect a Trace
Click any trace row to open the detailed trace view. You'll see:
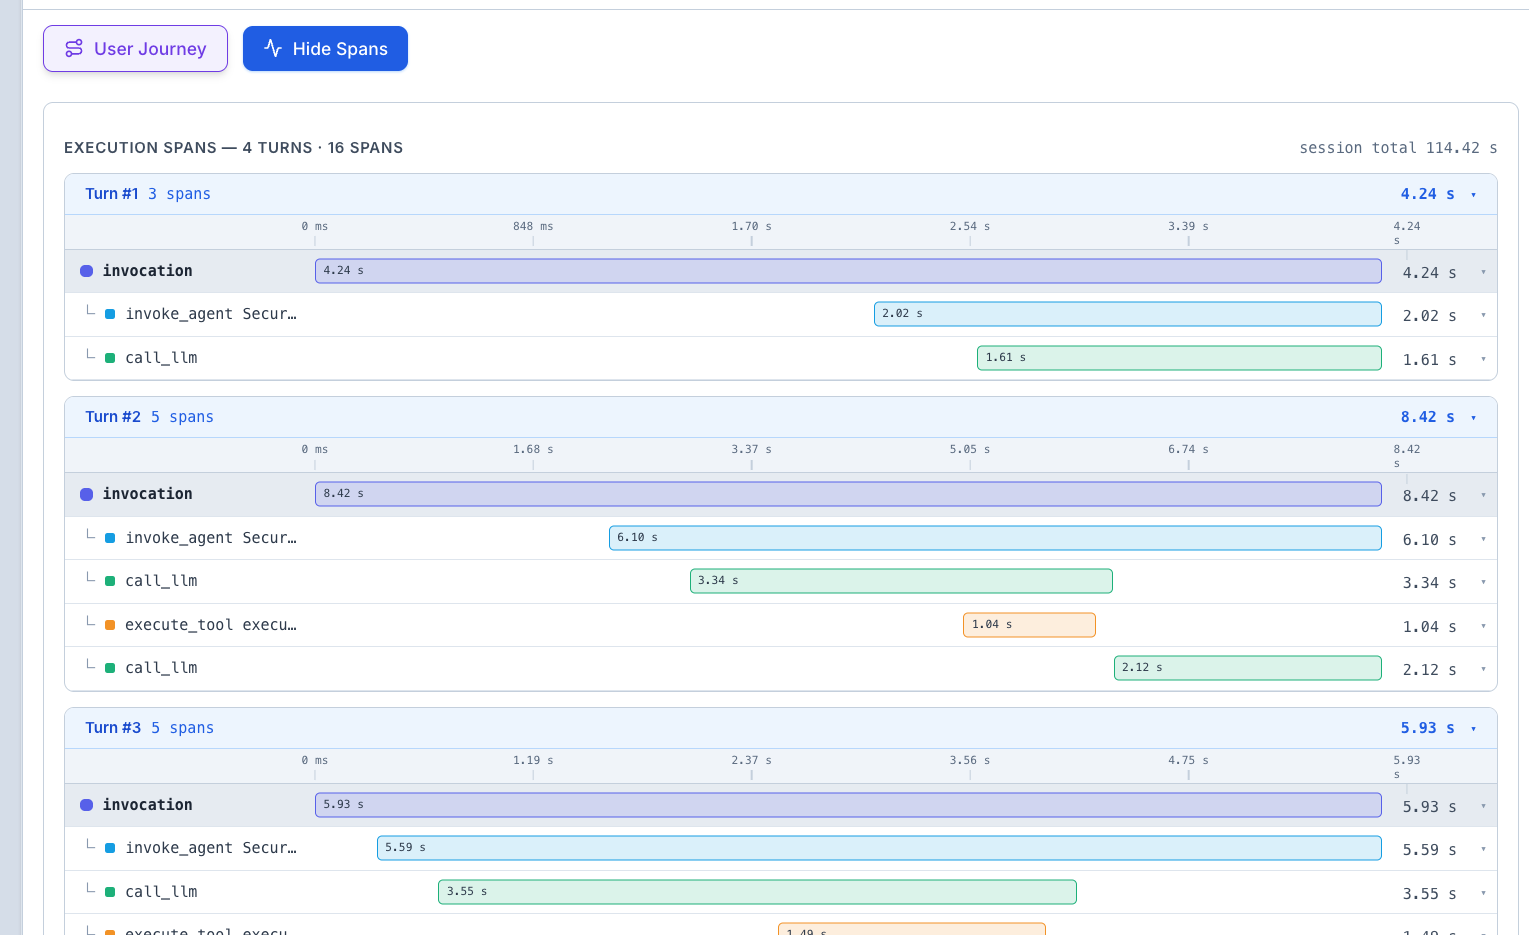
The Waterfall Timeline
This is the most important visualization. It shows:
- Every internal step (span) laid out on a horizontal timeline
- How long each step took — wider bars mean longer steps
- Hierarchical nesting — parent spans contain child spans (e.g., an "agent call" span contains multiple "tool call" spans inside it)
- Color coding — different colors for different operation types (LLM calls, tool calls, agent calls, etc.)
How to read it:
- Look for the widest bar — that's the bottleneck (the step that took the most time)
- Look for red bars — these indicate errors or failures
- Look at the nesting — this shows you the logical flow (e.g., the agent first searched, then reasoned, then responded)
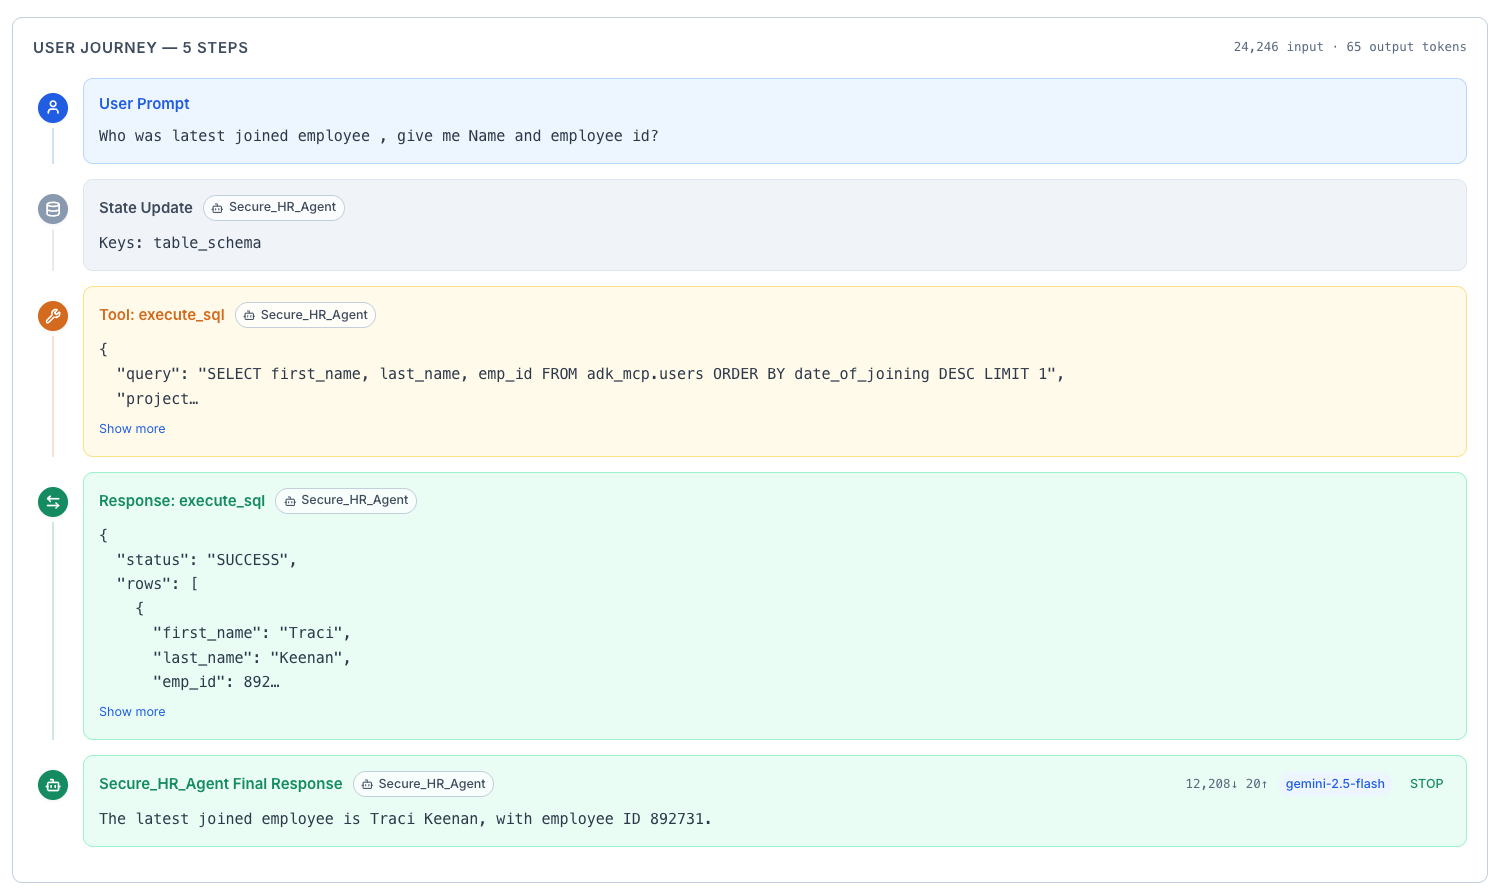
The User Journey View
While the waterfall shows technical details, the User Journey tab translates the trace into a human-readable narrative. It answers questions like:
- "Why did the agent decide to search the web for this query?"
- "Which specific tool provided the data used in the response?"
- "What was the agent's reasoning process before it answered?"
Step 4: Click on Individual Spans
Click any span (bar) in the waterfall to see its details:
- Name — what the operation was (e.g., "llm_call", "tool_execute", "search_web")
- Duration — how long it took
- Input — what was sent to this step
- Output — what this step returned
- Error details — if the span failed, the exact error message and stack trace
Key Metrics in Traces
| Metric | What It Means | What to Look For |
|---|---|---|
| Success Rate | Percentage of agent calls that completed without errors | Below 95% means something needs investigation |
| Total Duration | End-to-end time from user prompt to final response | Consistently high durations may indicate infrastructure issues |
| Total Tokens | Sum of all tokens used across all LLM calls in the trace | Unexpectedly high token counts may indicate inefficient agent logic |
| Span Count | Number of internal steps in the trace | High span counts may indicate overly complex agent workflows |
Common Debugging Scenarios
| Problem | What to Look For in Traces |
|---|---|
| "The agent is slow" | Open the waterfall and find the widest bar — that's your bottleneck. Is it an LLM call (model is slow) or a tool call (external service is slow)? |
| "The agent gave a wrong answer" | Check the User Journey to see what data the agent gathered. Was the source data correct? Did the agent misinterpret it? |
| "The agent keeps hitting token limits" | Look at the total tokens metric. Check if the agent is making too many LLM calls or if individual calls are too verbose |
| "The agent errors intermittently" | Filter by ERROR status and look for patterns — is it always the same tool failing? The same time of day? |
| "The agent doesn't use the right tool" | Check the span list to see which tools were called. Compare against what you expected |
Expected Output
When you view a trace, you should see something like:
[User Message] → "What were our Q3 revenue numbers?"
  ├── [LLM Call] Agent reasoning (1.2s) — Agent decides it needs to search the database
  ├── [Tool Call] query_database (2.5s) — Fetches Q3 revenue data
  ├── [LLM Call] Agent reasoning (0.8s) — Agent formulates the response using the data
  └── [Response] "Your Q3 revenue was $4.2M, up 15% from Q2..."

Total Duration: 4.5s | Total Tokens: 1,250 | Status: STOP (success)
Tips for Beginners
- Start with recent traces — set the time range to "Last 5 min" and then send a message to an agent. Your trace should appear within seconds.
- Compare fast vs. slow traces — if an agent is sometimes fast and sometimes slow, compare the waterfall timelines to spot the difference.
- Red means trouble — any red-colored span indicates an error. Click it to see the error details.