Load Test — Performance Under Pressure
Access: Users with Eval permission enabled by their Admin
Load Testing simulates multiple users sending messages to your agent simultaneously, helping you understand how your agent's infrastructure performs under concurrent traffic.
What is Load Testing?
Think of it as a stress test for your agent's infrastructure. In production, multiple users may chat with your agent at the same time. Load testing answers:
- Can my agent handle 10/50/100 simultaneous users?
- How does response time change under load?
- At what point does the infrastructure start failing?
- Are there rate limit issues I need to address?
Why it matters:
- An agent that responds in 2 seconds with one user might take 30 seconds with 50 concurrent users
- LLM APIs have rate limits that can cause failures under high load
- Users abandon conversations if response times exceed 5–10 seconds
- It's far better to discover these limits in testing than in production
How to Configure a Load Test
Step 1: Navigate to Load Test
Go to Eval in the sidebar → click the Load Test tab.
Step 2: Set Up the Test
- Select the agent to test from the dropdown.
- Enter test prompts — one or more messages that will be sent by virtual users. Use prompts that represent typical usage:
- "What are your business hours?"
- "Help me debug this Python error: IndexError..."
- "Summarize the Q3 earnings report"
- Set concurrent users — the number of virtual users sending messages simultaneously (e.g., 5, 10, 25, 50).
- Set total requests — the total number of messages to send across all virtual users (e.g., 50, 100, 200).
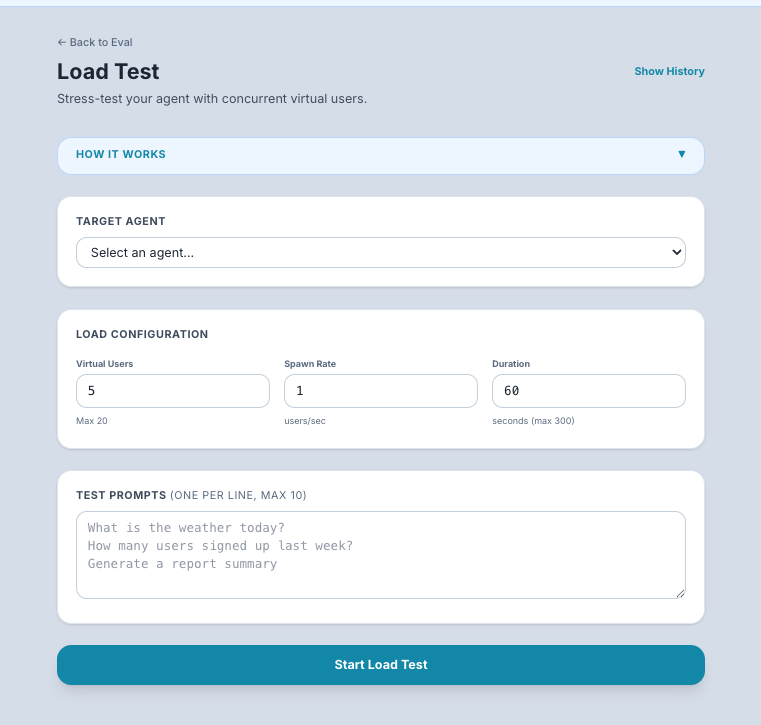
Step 3: Run the Test
Click Start Test.
What happens: The system creates the specified number of virtual users, each sending messages from your prompt list simultaneously. It records timing, success/failure, and response details for every request.
How long it takes: Depends on your concurrent users, total requests, and agent response time. A typical test with 10 users and 50 requests takes 1–5 minutes.
Understanding the Results
Summary Metrics
| Metric | What It Means | What to Look For |
|---|---|---|
| Total Requests | Number of messages sent | Should match your configuration |
| Successful Requests | Messages that got a valid response | Ideally equals total requests (no failures) |
| Failed Requests | Messages that errored or timed out | Any failures need investigation |
| Success Rate | Percentage of successful requests | Target: 99%+ for production readiness |
| Requests/Second | Throughput — how many requests your agent handles per second | Higher is better |
| Avg Latency | Average response time across all requests | Target: under 5 seconds for good UX |
| Min Latency | Fastest response | Your agent's best-case performance |
| Max Latency | Slowest response | Your agent's worst-case performance — high values indicate bottlenecks |
Latency Distribution Chart
A bar chart showing how response times are distributed across buckets:
0-1s:  ████████████ (30 requests)
1-2s:  ████████ (20 requests)
2-5s:  ████ (10 requests)
5-10s: ██ (5 requests)
10s+:  █ (2 requests)
What to look for:
- A tight distribution (most requests in the 0–2s range) means consistent performance
- A long tail (many requests in 5s+ range) means performance degrades under load
- A bimodal distribution (two peaks) may indicate intermittent infrastructure issues
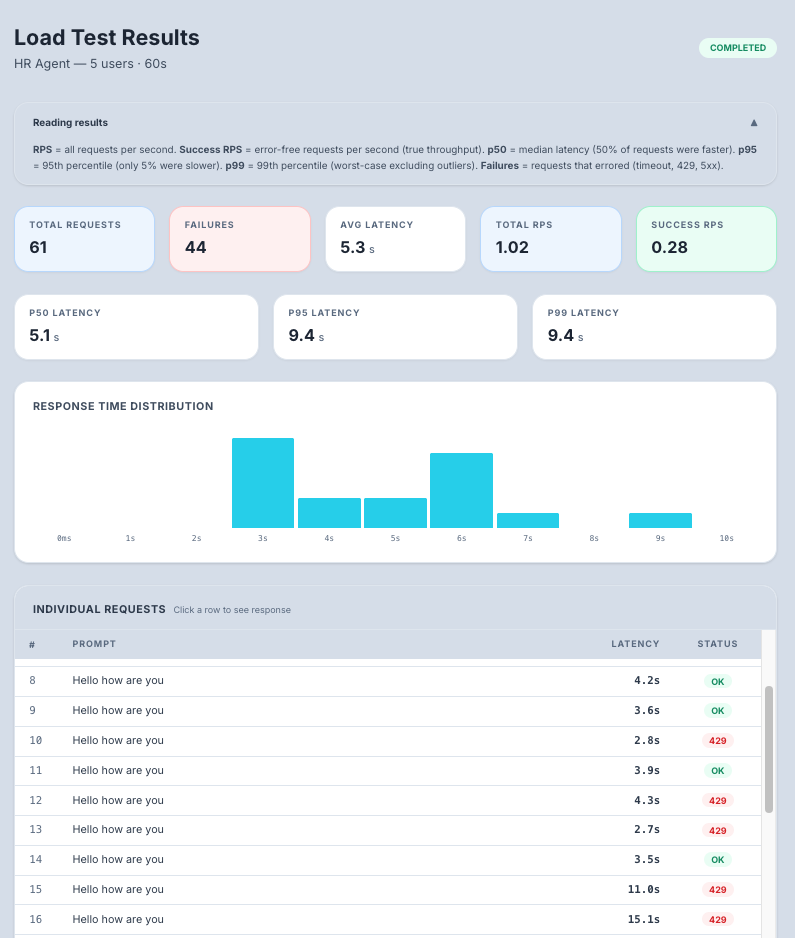
Per-Request Table
An expandable table showing individual request results:
| Column | What It Shows |
|---|---|
| Request # | Sequential request number |
| Status | HTTP status code (200 = success, 429 = rate limited, 500 = server error) |
| Latency | Response time for this specific request |
| Response | The agent's response (expandable) |
| Error | Error details if the request failed |
Common Results and What They Mean
| Result Pattern | Diagnosis | Fix |
|---|---|---|
| All requests succeed, latency stays low | Your agent handles this load well | Try increasing concurrent users to find the limit |
| Success rate drops as load increases | Your infrastructure is at capacity | Scale up your agent's deployment (more instances, more CPU/memory) |
| Many 429 errors (rate limited) | Your LLM API quota is too low | Request a quota increase from your LLM provider, or reduce concurrent users |
| Latency increases linearly with users | Your agent processes requests sequentially | Enable horizontal scaling (multiple agent instances) |
| Some requests timeout | Agent infrastructure is overwhelmed | Add more compute resources or implement request queuing |
Run History
Previous load test runs are saved and accessible from the history list. This lets you:
- Compare performance across runs — Did scaling up your infrastructure help?
- Track improvements over time — Is latency improving as you optimize?
- Establish baselines — Know your agent's performance at different load levels
Tips for Beginners
- Start small — Begin with 5 concurrent users and 20 total requests. Increase gradually.
- Use realistic prompts — Test with the kinds of messages your real users will send. Short questions and long documents behave very differently.
- Watch for 429 errors — These mean your LLM API is rate-limiting you. This is the most common issue and is solved by requesting a higher quota.
- Run before launch — Always load test before opening your agent to a large user base.
- Test at 2x expected load — If you expect 20 concurrent users, test with 40 to have a safety margin.
Tip: If you see many rate-limit errors (429s), reduce the number of concurrent users. Your agent's underlying LLM API has its own quota limits that TraptureIQ cannot control.